#Using datasets to find distance matrix
#Applying hierarchical clustering
------------------------------------------- --
d <- dist(as.matrix(mtcars))
hc <- hclust(d)
plot(hc)
----------------------------------------------
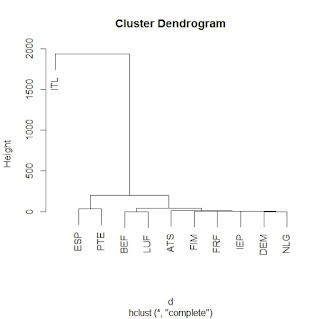
d <- dist(as.matrix(euro))
hc <- hclust(d)
plot(hc)
----------------------------------------------
d <- dist(as.matrix(Orange))
hc <- hclust(d)
plot(hc)
----------------------------------------------
#Package for marketing and micro-econometrics applications.
install.packages("bayesm")
library("bayesm")
library(bayesm)
data(rivers)
str(rivers)
#to gather data in R from an HTML page
require(rvest) #rvest is the package for this task
require(ggplot2)
require(dplyr)
require(scales)
require(maps)
#use of aggregate with a base function to get day of each month
dates <- data.frame(date = as.Date("2001-01-01", format = "%Y-%m-%d") + 0:729)
dates
last.day <- aggregate(x = dates["date"],
by = list(month = substr(dates$date, 1, 7)),
FUN = max)
last.day


No comments:
Post a Comment